The trade atlas
What Guatemala sells, and to whom.
Goods trade exactly as the country declares it to the United Nations: the chapters that earn the most, the countries that buy them, and the balance left between what leaves and what arrives. One year at a time, with the whole series behind it.
Where the value concentrates.
- Coffee, tea, maté and spicesUS$1,632.0 M
- Edible fruit and nutsUS$1,492.3 M
- Apparel and clothing accessories, knittedUS$1,411.0 M
- Sugars and sugar confectioneryUS$1,112.3 M
- Animal, vegetable or microbial fats and oilsUS$819.3 M
- Plastics and articles thereofUS$576.0 M
- Paper and paperboard and articles thereofUS$442.9 M
- Pharmaceutical productsUS$441.6 M
- Miscellaneous edible preparationsUS$440.6 M
- Soap, washing preparations, candlesUS$415.5 M
- Beverages, spirits and vinegarUS$411.8 M
- Mineral fuels and mineral oilsUS$389.9 M
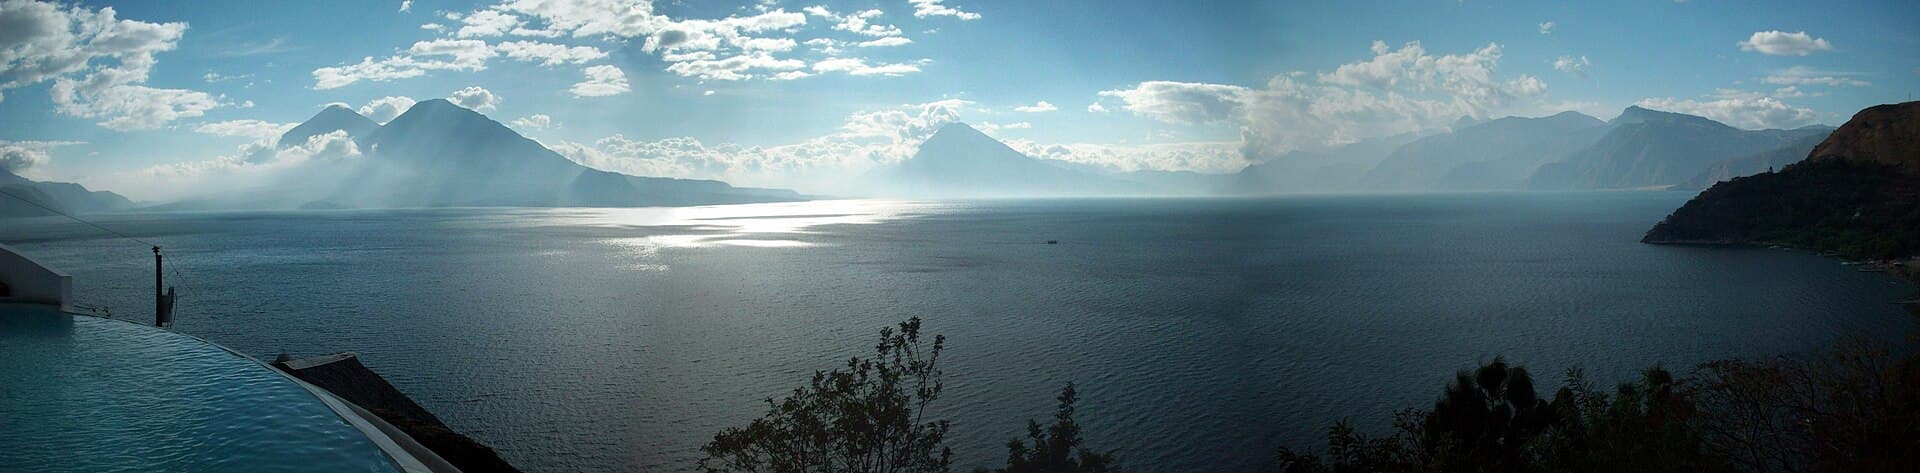
It leaves these mountains and does not stop at the border.
Where Guatemalan goods land.
Borders: Natural Earth 110m (public domain). Country names follow the United Nations M49 nomenclature. The projection changes no value: it only places it. Source: UN Comtrade · retrieved Aug 19, 2026, 23:42. Figures print exactly as the record declares them, in current dollars.
Guatemalan trade fits inside a handful of countries.
- United States of AmericaUS$4,870.1 M
- El SalvadorUS$2,136.8 M
- HondurasUS$1,783.2 M
- NicaraguaUS$1,089.1 M
- MexicoUS$689.7 M
- Costa RicaUS$667.0 M
- NetherlandsUS$556.8 M
- PanamaUS$312.6 M
- Dominican RepublicUS$294.1 M
- CanadaUS$286.8 M
- SpainUS$205.3 M
- JapanUS$180.7 M
The full series
Follow one product through its years.
Coffee, tea, maté and spices
10.5%
| Year | Declared value |
|---|---|
| 2019 | US$1,320.8 M |
| 2020 | US$1,795.7 M |
| 2021 | US$1,597.4 M |
| 2022 | US$1,544.1 M |
| 2023 | US$1,331.9 M |
| 2024 | US$1,426.9 M |
| 2025 | US$1,632.0 M |
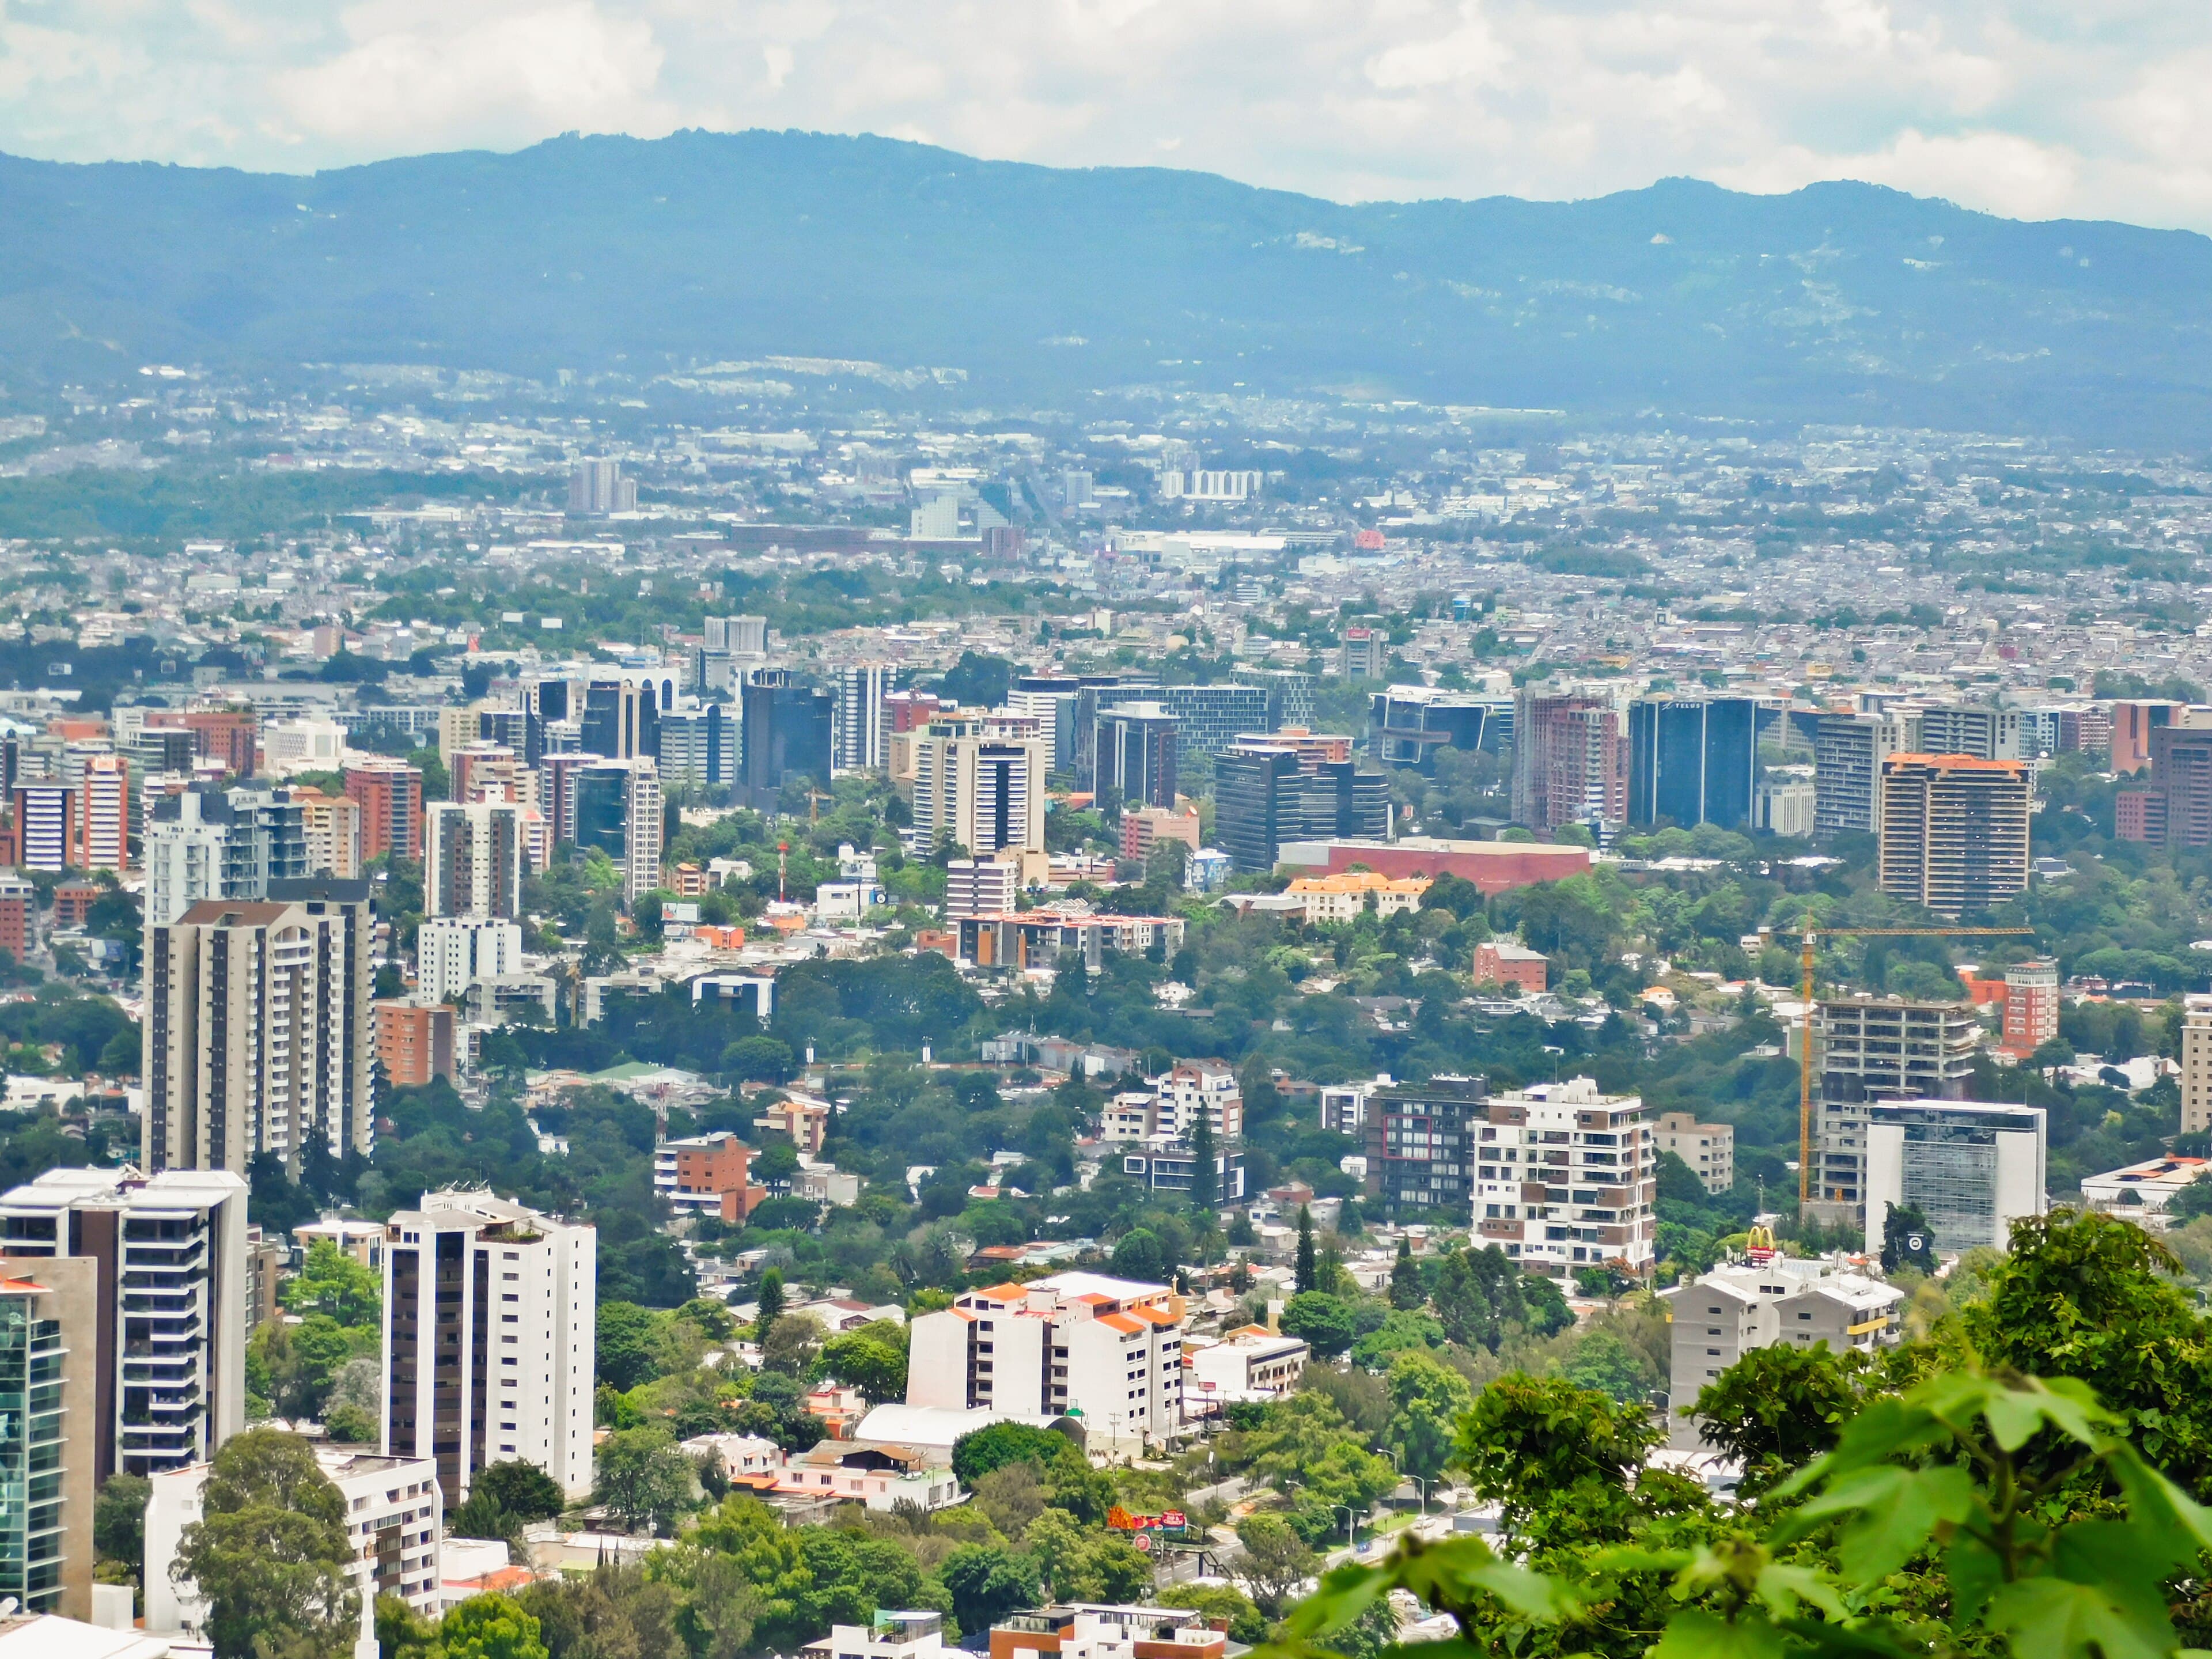
A country does not only sell. It also buys.
The balance
What leaves, what arrives, and the distance between them.
Exports
US$15,611.3 M
Imports
US$34,578.0 M
Balance
US$−18,966.7 M
Goods only: no services, no remittances, no income. The balance is exports minus imports, in current dollars of the declared year. Source: UN Comtrade · retrieved Aug 19, 2026, 23:42. Figures print exactly as the record declares them, in current dollars.
Two measurements
The same year, counted twice.
The United Nations and Banco de Guatemala measure the same year separately, and neither one corrects the other. They differ because they do not count the same things: which goods fall inside the coverage, at what value each is recorded, and which year re-exports land in. Both readings are printed here, and so is the distance between them.
US$15,611.3 M
UN Comtrade
Difference
9.1%
US$14,309.4 M
Banco de Guatemala
The two readings sit 9.1% apart, within what coverage and the timing of recording explain.
Source: UN Comtrade · retrieved Aug 19, 2026, 23:42. Figures print exactly as the record declares them, in current dollars.